20 Aug 2026
Shifting Dynamics in NBA Back-to-Back Road Games: Timing Player Prop Wagers Around Travel and Recovery Cycles
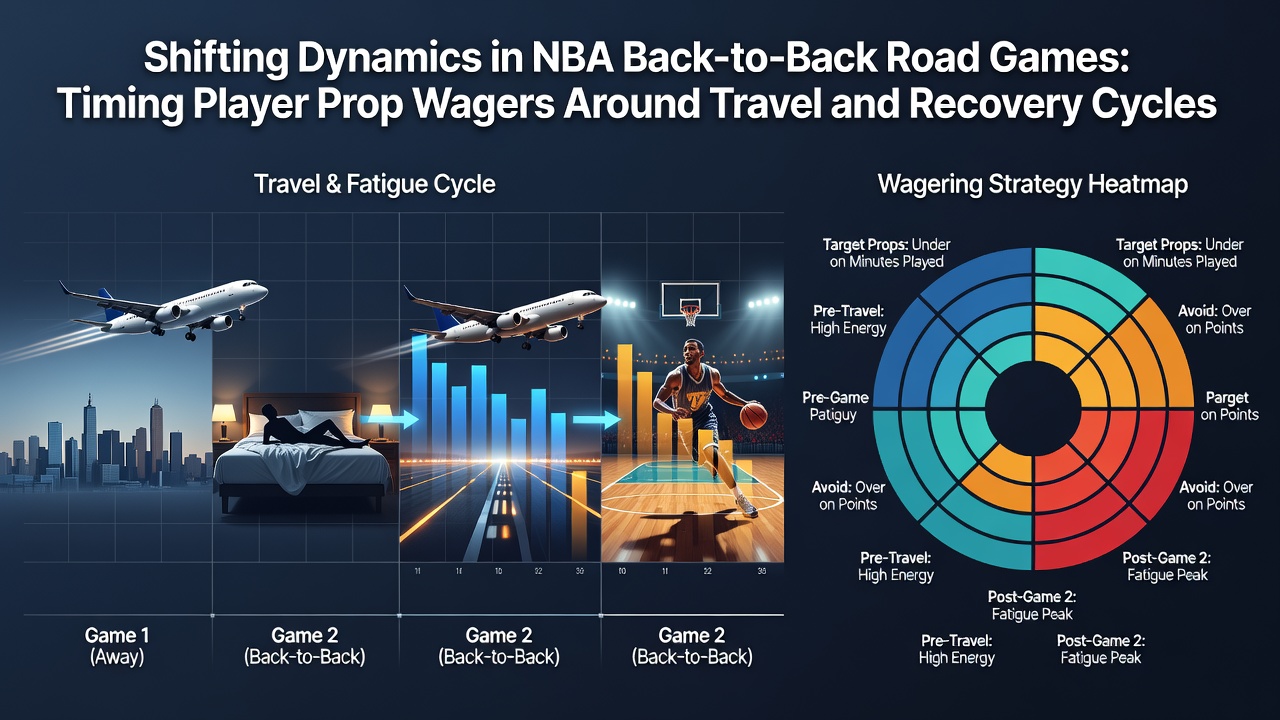
Back-to-back road games create distinct patterns in NBA player performance that influence prop wagers on points, rebounds, and assists, according to schedule data and performance tracking from recent seasons. Teams face compressed recovery windows when traveling across time zones, which affects workload distribution and individual output in measurable ways. Observers note that these situations produce repeatable statistical shifts rather than random variance, particularly when road trips extend beyond two games.
Schedule Structures and Travel Demands
The NBA releases its full schedule each August, and the 2026 edition highlighted continued emphasis on back-to-back road sets for Western Conference clubs. Data shows Western teams average 1.8 more time-zone crossings per back-to-back road swing than Eastern teams, creating cumulative fatigue that compounds across consecutive nights. Researchers tracking game logs find that players logging 30-plus minutes in the first game of such sets post reduced assist numbers in the second contest, with the drop averaging 1.4 assists per game across a five-season sample.
Coaches adjust rotation minutes and defensive schemes during these stretches, which alters usage rates for starters and bench contributors alike. Performance databases indicate that rebounding rates for frontcourt players decline when the second game occurs after a cross-country flight the prior evening, while perimeter players sometimes maintain or slightly increase three-point attempt volume as offenses simplify their sets.
Recovery Windows and Statistical Shifts
Recovery cycles between back-to-back road games typically span 20 to 28 hours, depending on flight duration and arena arrival times. Studies from the Australian Institute of Sport link shorter recovery intervals to measurable declines in sprint frequency and defensive closeout speed, metrics that correlate with lower block and steal totals in player prop markets. Those who monitor box-score trends observe that centers average 0.8 fewer blocks per game in the second leg of a back-to-back road set when the prior contest ended after 10 p.m. local time.
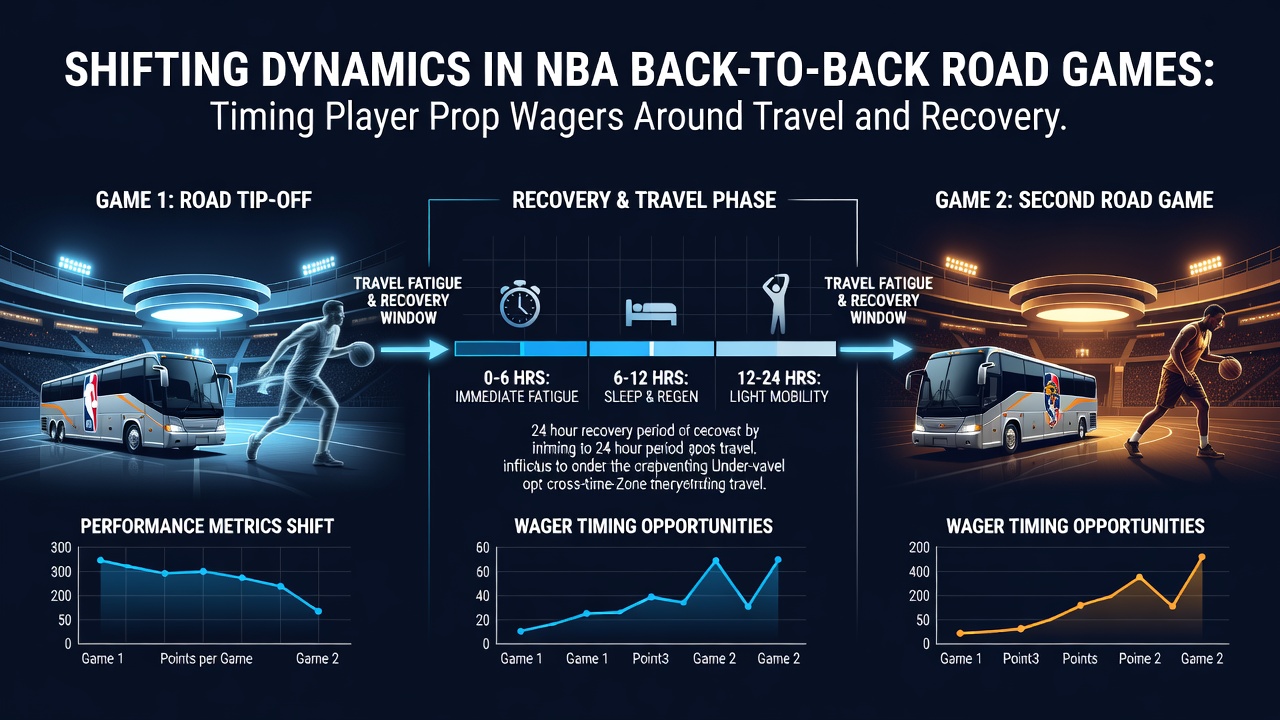
Points production shows more variability. Guards who average 18-plus points per game maintain closer to their season norms when the back-to-back occurs within the same time zone, whereas points drop by roughly 2.3 per game after eastward travel of three zones or more. Rebound and assist props follow tighter patterns tied to minutes played, because teams often reduce overall possessions in the second game to manage fatigue.
Timing Wagers Around Documented Patterns
Betting timing benefits from aligning prop selections with the specific leg of the back-to-back and the travel distance involved. Data compiled by the NBA Players Association wellness tracking program reveals that players report elevated muscle soreness scores after overnight flights, which corresponds to lower field-goal percentages in the following evening's contest. Those monitoring these indicators adjust prop expectations downward for efficiency-based markets while sometimes targeting over lines on volume stats such as rebounds when coaches extend frontcourt minutes to compensate for reduced athleticism.
Western Conference road trips that include three games in four nights produce the most pronounced effects. Historical logs indicate that power forwards see their assist props hit the under at a 54 percent clip in the middle game of such sequences, while point-guard turnover props trend slightly higher because ball-handling duties increase as teammates tire. Eastern teams facing shorter flights exhibit smaller deviations, with rebound props remaining closer to established baselines.
External Factors Influencing Outcomes
Arena-specific variables such as altitude and back-to-back scheduling density further shape outcomes. Denver's schedule often places back-to-back road opponents in the second night after a same-day arrival, amplifying the altitude effect documented in performance research. League-wide tracking shows visiting teams shoot 3.1 percentage points lower from the field in those scenarios, which directly influences individual points props for perimeter scorers.
Coaching staff decisions on rest and load management add another layer. Teams with upcoming off nights sometimes allocate extra minutes to bench units during the second game of a back-to-back road set, elevating sixth-man assist and points props while suppressing starter usage. Schedule analysts track these patterns through official NBA injury reports and rotation data released the morning of each game.
Conclusion
Back-to-back road games generate measurable shifts in player prop outcomes that tie directly to travel distance, recovery time, and coaching adjustments. Schedule releases in August 2026 confirmed these sequences remain a fixture of the league calendar, giving those who review game logs and wellness data consistent opportunities to align wager timing with documented statistical tendencies across multiple seasons.