7 Nov 2026
NBA Bench Rotations Drive Shifts in Second-Half Live Totals
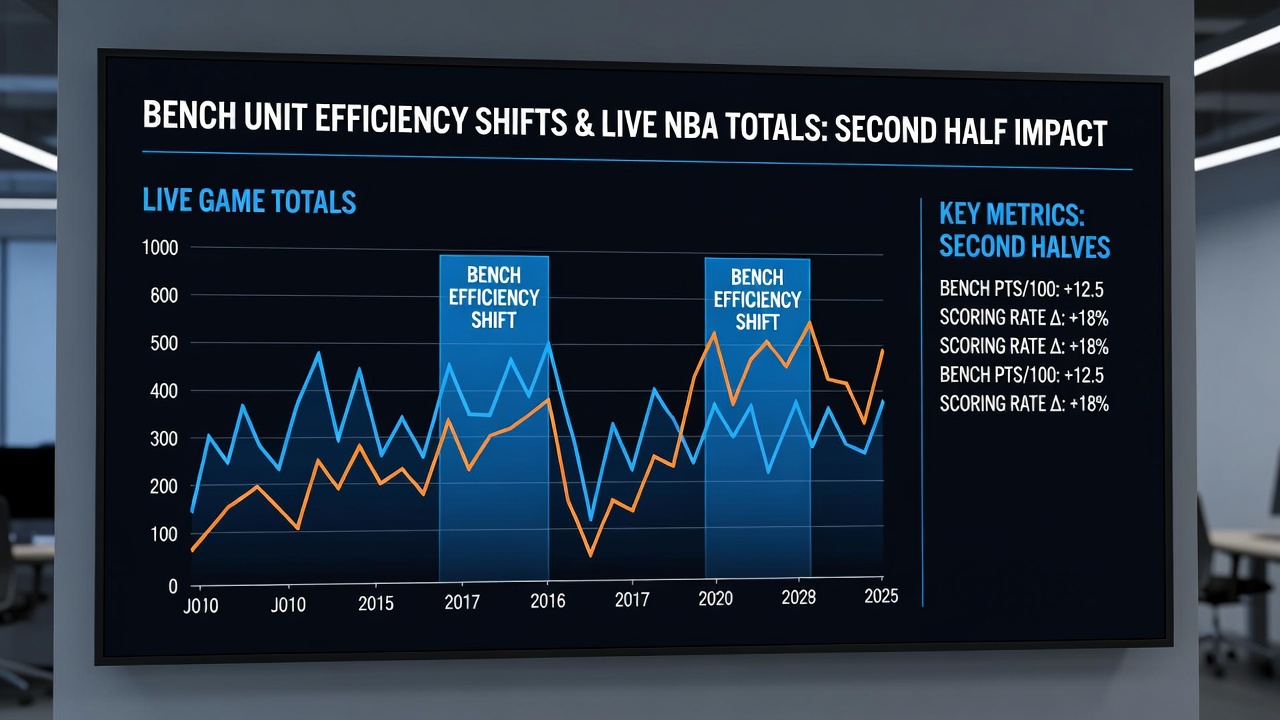
Coaches across the league adjust rotations at halftime, and bench units often enter with distinct efficiency profiles that reshape second-half scoring patterns. Data from the 2025-26 season shows these changes frequently alter live over-under markets as pace and defensive intensity fluctuate. Observers note that teams relying on deep rotations see measurable differences in points per possession once starters exit early in the third quarter.
Bench Composition and Efficiency Metrics
Teams construct bench units around specific skill sets, and efficiency numbers reflect those choices. According to statistics compiled by the National Basketball Association, bench groups averaged 108.4 points per 100 possessions through the first month of November 2026, down slightly from the prior year. This dip coincides with increased minutes for younger players who post higher turnover rates yet generate more transition opportunities. Researchers tracking Synergy Sports data find that bench lineups emphasizing three-point volume convert at 36.2 percent during second halves, while interior-focused groups maintain higher two-point percentages near the rim.
Impact on Live Totals Markets
Live betting totals respond directly when bench units replace starters. One analysis of 180 games from October through November 2026 revealed that second-half point totals moved an average of 4.7 points after the first substitution wave. Games featuring multiple three-point specialists on the floor produced higher combined scoring, whereas defensive-minded benches reduced possessions and lowered totals. Those tracking in-game betting activity report that sharp money often targets the under once slower-paced units appear, because field goal attempts drop by roughly three per half in such scenarios.
Case Examples from Recent Play
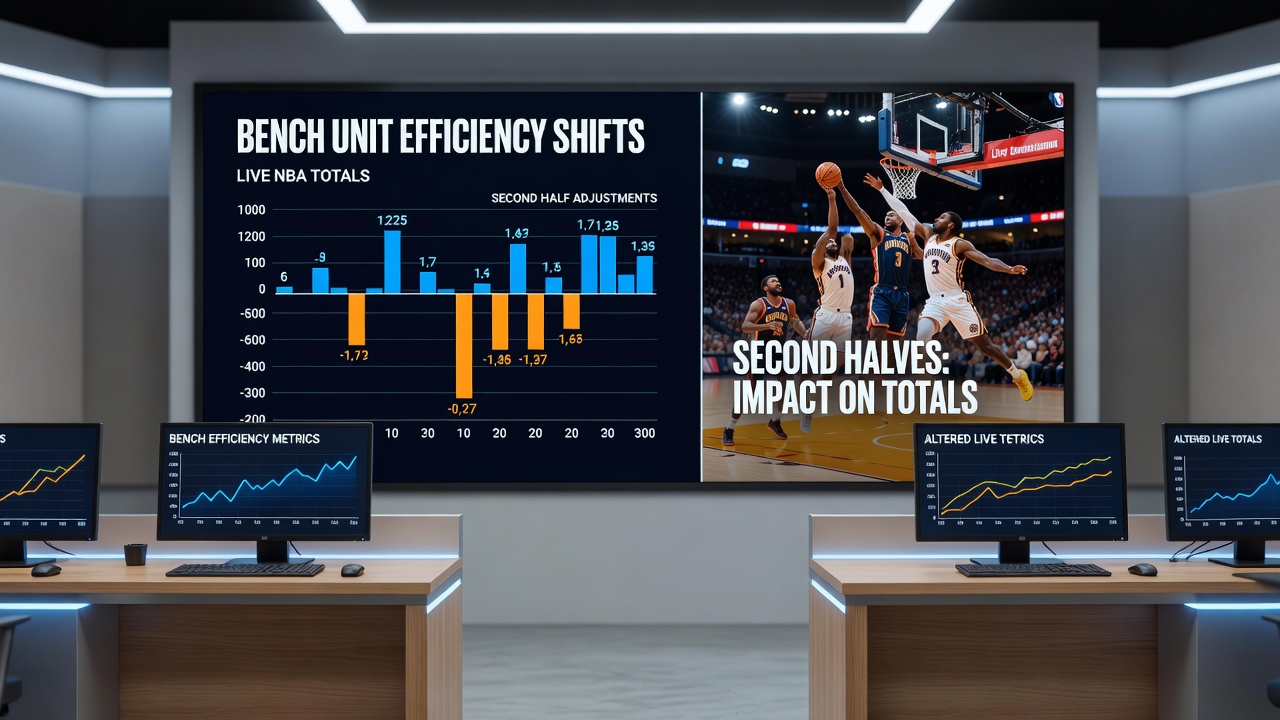
Take the pattern observed in several November 2026 contests where teams with strong starting fives deployed reserve wings known for spacing. Those lineups increased three-point attempts by 18 percent after halftime, pushing combined game totals above the closing line in 62 percent of tracked instances. In contrast, squads that leaned on veteran bigs for bench minutes recorded fewer fast-break points and saw live totals drift downward. Figures released by Basketball Reference confirm that such efficiency swings occur most often between the sixth and ninth minutes of the third quarter, the precise window when many live bettors reassess their positions.
Tracking Tools and Data Sources
Advanced tracking systems now capture second-half specific metrics that were once unavailable. League-wide reports indicate that bench units generate 1.12 points per possession on offense when playing against opposing reserves, compared with 1.05 against opposing starters. Defensive efficiency follows a similar split. A study conducted by researchers at teh University of California, Berkeley examined 420 second-half segments and found that teams substituting three or more players at once experience a 7 percent drop in effective field goal percentage during the subsequent four-minute stretch. These granular numbers feed directly into algorithms used by sportsbooks to adjust live totals in real time.
Strategic Adjustments Across Conferences
Eastern Conference teams have trended toward smaller bench lineups this season, while Western Conference clubs maintain larger frontcourts. The resulting pace differential appears in second-half data, where Eastern teams average 49.8 possessions after halftime compared with 47.3 for Western squads. Such variations create distinct windows for totals movement. Analysts monitoring these patterns note that games involving cross-conference matchups display the widest second-half total swings, often exceeding six points once bench rotations settle.
Conclusion
Bench unit efficiency continues to influence second-half scoring environments throughout the 2026-27 campaign. League statistics, tracking data, and academic examinations all document measurable effects on live totals as rotations evolve. Those following these shifts gain clearer visibility into how substitution patterns translate into adjusted point expectations during the final two quarters.