15 Aug 2026
How Schedule Density Influences NBA Division Standings Wagering Outcomes
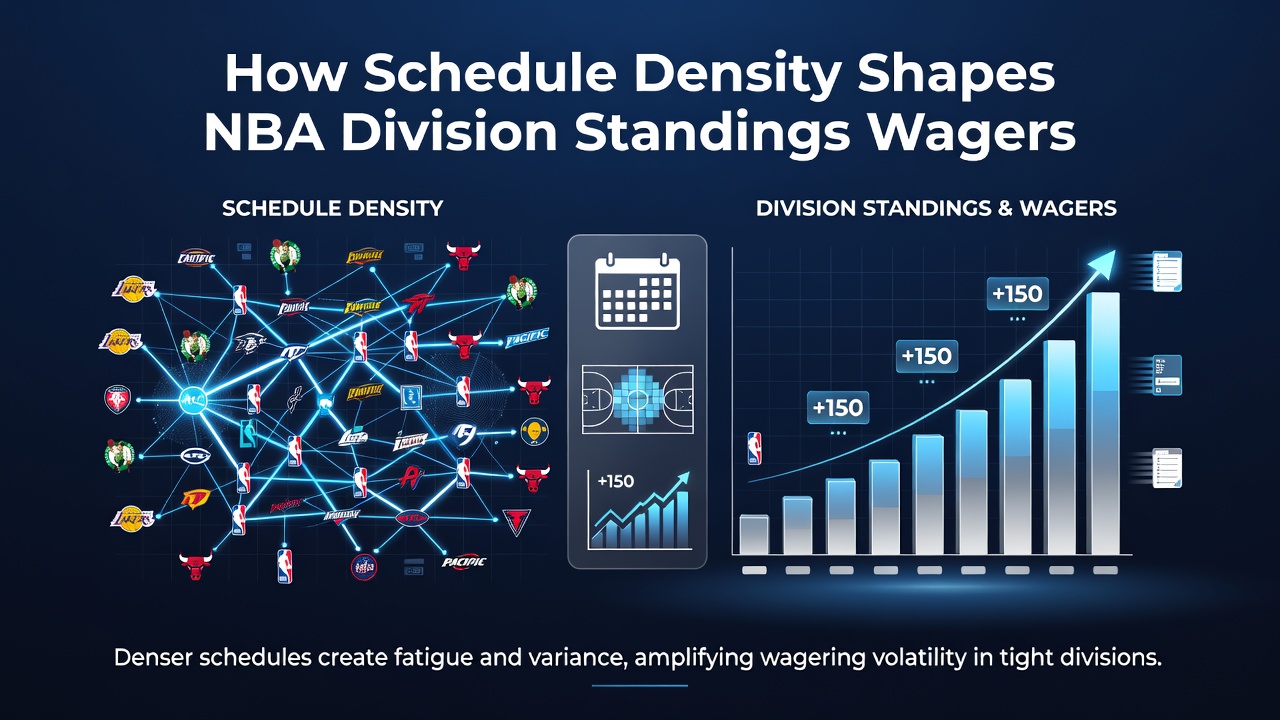
Schedule density in the NBA refers to clusters of games played with minimal rest, including back-to-backs, three-in-four-nights stretches, and extended road trips that span multiple time zones. These patterns occur regularly across the 82-game regular season and create measurable variations in team performance that directly affect division standings wagers. Observers note that divisions with tighter races often see outcomes shift based on which teams face denser portions of the calendar during key months.
Defining Schedule Density in the NBA Context
Teams encounter uneven distributions of rest throughout the season because the league balances national television demands with arena availability and travel logistics. Data from recent seasons shows that some clubs play as many as five back-to-backs in a single month while others receive more evenly spaced games. Researchers at sports analytics programs have tracked these patterns and found correlations between high-density periods and declines in shooting efficiency, defensive rating, and overall point differential. When divisions feature multiple teams with similar records entering December or January, these schedule imbalances become decisive factors in final standings.
Performance Variations Tied to Rest and Travel
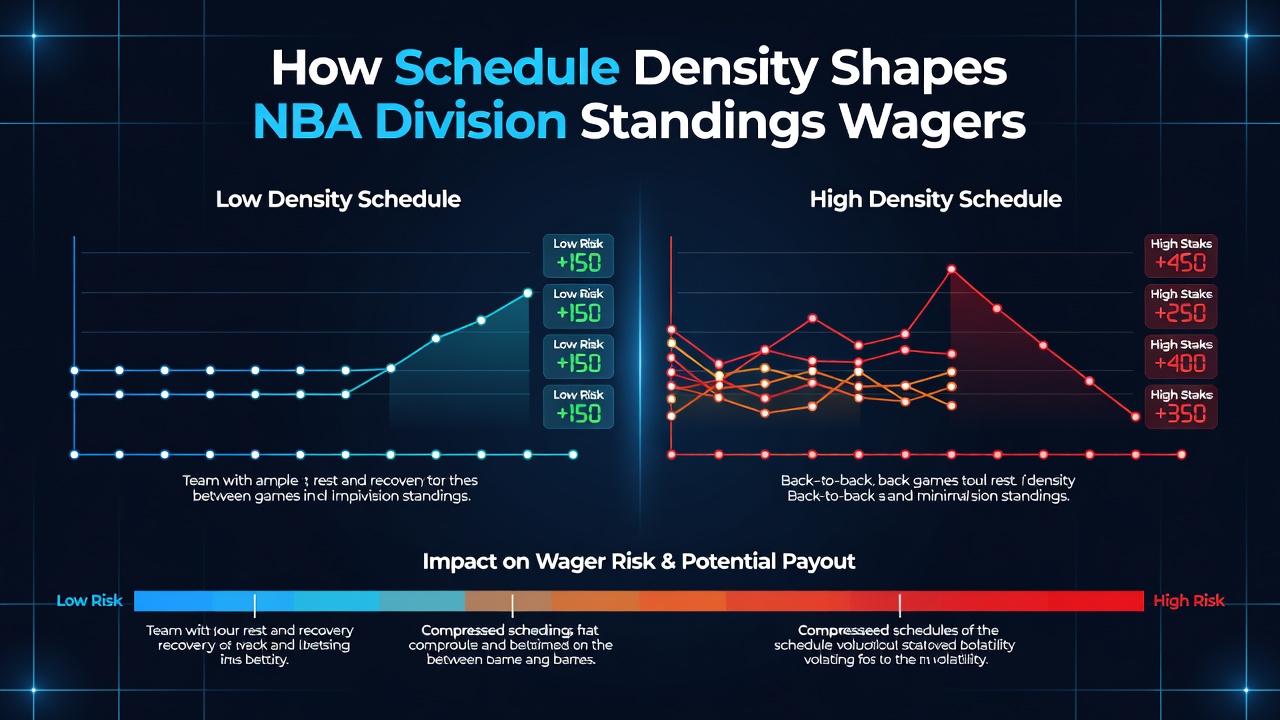
Studies of player tracking data indicate that teams on the second night of a back-to-back experience average drops in effective field goal percentage and increased turnover rates. The effects compound during longer stretches such as four games in five nights or cross-country flights followed by immediate tip-offs. Division standings wagers gain complexity because one team may finish its season with several favorable home stands while a rival plays three road games in four nights during the final week. These differences accumulate over 82 games and alter point totals that determine playoff seeding within each division.
Coaching staffs adjust rotations and minutes distributions in response to upcoming density, yet the adjustments do not fully offset fatigue for every player. Bench production often rises during high-density periods as starters receive reduced minutes, which in turn influences prop markets tied to individual contributions. Standings bettors therefore examine remaining schedules for each team in a division rather than relying solely on current records or head-to-head results.
Division-Specific Implications for Wagering Markets
Each NBA division contains teams with varying travel footprints due to geographic spread. The Pacific Division, for example, features multiple West Coast clubs that face fewer long-haul flights compared with Central Division teams that regularly cross multiple time zones. When schedule density peaks coincide with division games, the team returning from a heavy travel stretch may underperform relative to expectations. Bettors who model these variables adjust their projections for division winner odds and place futures accordingly.
August 2026 preparations for the upcoming season already include preliminary schedule analysis by analytics departments across the league. Early release of portions of the 2026-27 calendar allows initial evaluations of which clubs will encounter the heaviest December and March clusters. These early assessments feed into futures markets where division standings wagers attract steady action months before opening night.
Integrating External Data Sources for Edge Identification
Analysts cross-reference NBA schedule files with advanced metrics from sources such as official league tracking databases to quantify rest advantages. Additional insights come from academic reviews of sports scheduling conducted by research teams at institutions including the University of British Columbia, which examined travel fatigue across North American professional leagues. Combining these datasets reveals recurring patterns where certain divisions produce more predictable outcomes once schedule density is factored into models.
Live betting markets also reflect schedule effects as in-game odds adjust when teams display visible fatigue during dense stretches. Sharp bettors monitor real-time efficiency numbers against pregame projections that already incorporate rest data. The combination produces opportunities in both pregame futures and in-game division-related props throughout the season.
Long-Term Patterns and Market Adjustments
Over multiple seasons, teams with younger rosters or deeper benches have demonstrated greater resilience during high-density periods according to aggregated box-score data. Older or injury-prone lineups show larger performance gaps after consecutive road games. Division standings markets gradually incorporate these tendencies, yet late-season schedule releases still create windows where updated density information moves odds before the public fully adjusts.
Those who follow division futures track not only win totals but also the distribution of remaining home and away games within each cluster of dates. A team scheduled for four consecutive home games after a heavy travel stretch often gains ground in the standings relative to a rival facing the opposite sequence.
Conclusion
Schedule density functions as a structural variable that shapes NBA division standings and the wagering markets built around them. Teams facing concentrated stretches of games with limited recovery time exhibit predictable shifts in performance metrics that accumulate over the course of a season. Bettors who integrate rest data, travel logs, adn division-specific geography into their models gain access to information that influences both futures odds and in-season adjustments. As schedules for future seasons become available earlier each year, the role of density analysis continues to expand within professional handicapping processes.