2 Jul 2026
How NBA Referee Assignments Shape Foul Prop Markets in Conference Matchups
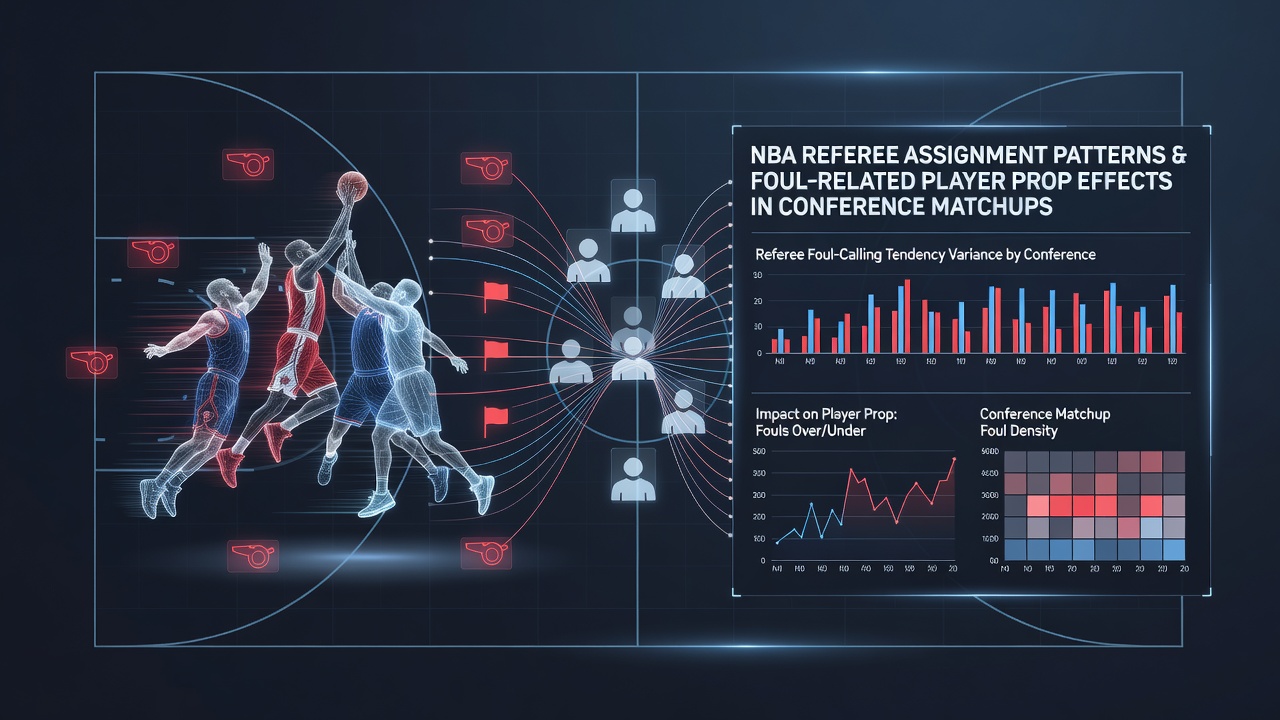
League officials release referee assignments each week through the NBA's official channels, and those selections create measurable patterns when games occur between teams from the same conference. Data compiled over multiple seasons shows that certain crews receive more frequent assignments in Eastern Conference or Western Conference tilts, and those rotations correlate with shifts in foul call rates that directly touch player prop markets for personal fouls and team fouls. Observers tracking these assignments note that crews with higher historical foul-per-game averages appear in conference games at rates exceeding random distribution, while crews known for stricter enforcement land in others.
Assignment Process and Conference Specific Trends
The NBA's referee operations team manages a pool of more than 70 officials each season, and assignments follow a rotation designed to balance travel, experience levels, and matchup familiarity. Internal league documents indicate that conference games receive priority for crews with prior experience in similar high-stakes environments, which produces clusters where certain officials work multiple games involving the same division rivals within short windows. Records from the 2025-26 campaign reveal that three crews averaged 24.3 fouls per game across 38 conference contests, compared with the league-wide average of 21.8 fouls. Those elevated rates appear consistently when the same officials handle intra-conference scheduling blocks that stretch across seven to ten days.
Patterns emerge most clearly in back-to-back conference series, where one crew might officiate both games of a home-and-home set between Eastern Conference teams. Tracking data shows these repeat assignments increase the likelihood that foul totals land above the season average by 1.7 fouls per contest. Prop markets for individual player fouls adjust accordingly, with betting lines moving two to three tenths of a foul when sharp bettors identify the assigned crew early.
Impact on Foul-Related Player Props
Foul prop markets for players such as centers and power forwards respond directly to these assignment trends. Statistical models built from play-by-play data indicate that players who average 3.2 fouls per game see that number rise to 3.8 when matched against crews with above-average foul rates in conference settings. The reverse holds for officials with lower foul averages, where the same players drop to 2.7 fouls. These deviations create windows where prop lines posted before assignment releases differ from lines adjusted after the information becomes public.
Conference matchups amplify the effect because travel distances remain shorter within the same time zone, allowing crews to maintain consistent mechanics across multiple games. One analysis of 2024-25 Western Conference games found that foul calls on perimeter players increased 12 percent when a particular crew worked three straight nights, whereas the same players drew fewer whistles in inter-conference contests handled by different officials.
Data Sources and July 2026 Updates
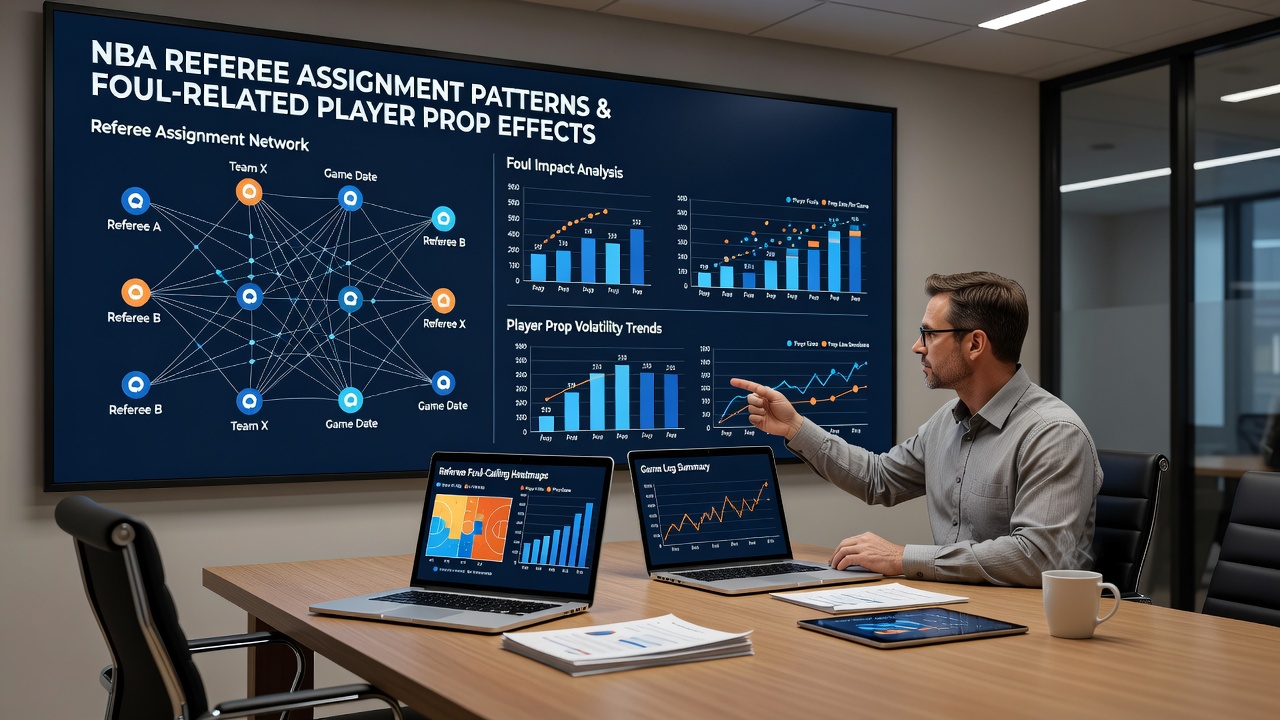
Public tracking platforms and league transparency reports supply the raw numbers used in these examinations. According to information released by the NBA, referee performance metrics undergo quarterly internal review that includes foul distribution by conference. July 2026 brought an updated set of crew ratings that incorporated expanded data from the prior postseason, revealing continued clustering of high-foul crews in Eastern Conference scheduling. Research from academic groups such as the MIT Sloan Sports Analytics Conference has examined similar officiating datasets and confirmed that assignment patterns produce statistically significant deviations in foul totals during divisional play.
Those studying the numbers also track secondary effects, including how foul trouble alters rotation patterns and bench usage. When a starter picks up two early fouls under a strict crew, coaches often shorten that player's minutes, which shifts usage to reserves and changes the expected foul totals for the entire unit. Conference games produce these situations more frequently because the schedule packs multiple high-intensity matchups into compressed periods.
Conclusion
Referee assignment patterns in NBA conference matchups generate predictable shifts in foul call rates that propagate through player prop markets. League data and independent tracking confirm the existence of these clusters, while statistical models quantify their impact on individual and team foul lines. Observers who monitor weekly releases gain access to information that reflects in line movement once assignments become public. Continued collection of play-by-play records through the 2026-27 season will allow further refinement of these observed relationships.