11 Jul 2026
How Initial NBA Performances Trigger Revisions in Midseason Betting Odds
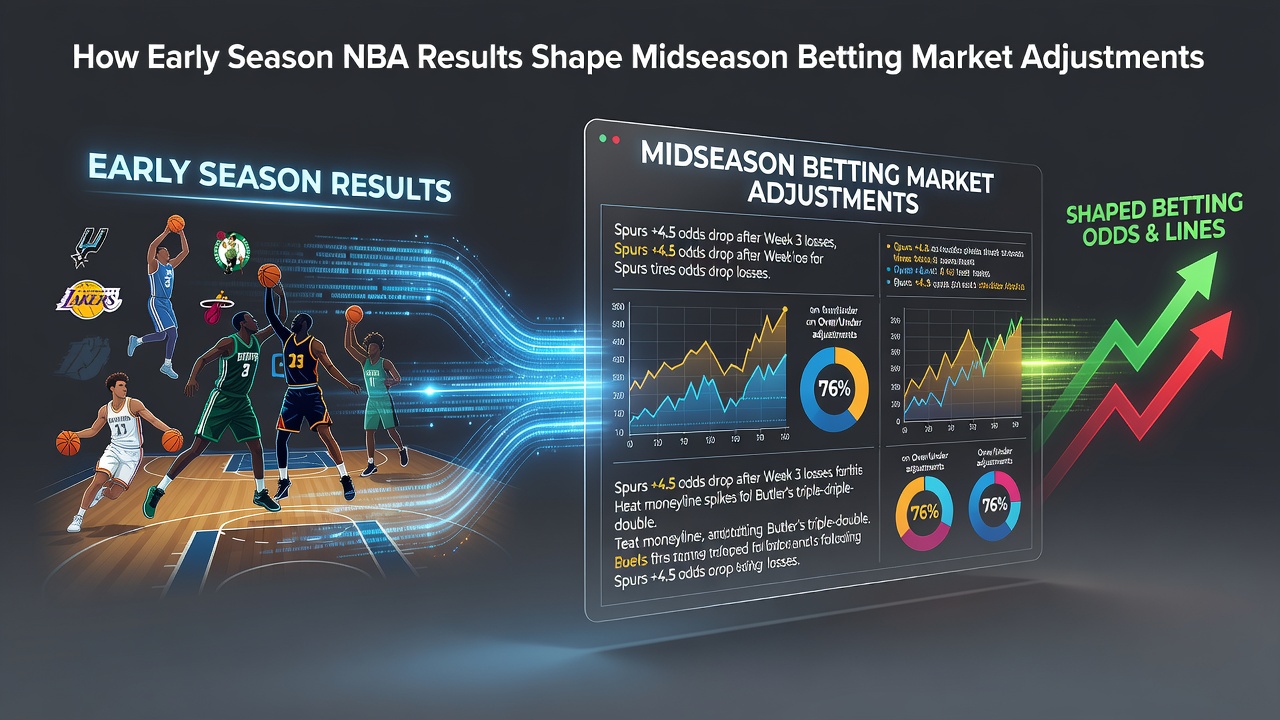
Early season NBA results feed directly into the algorithms and models that sportsbooks use to recalibrate spreads, totals, and player props once the schedule reaches its midpoint, and observers note that bookmakers track win rates, point differentials, and pace metrics from October through December to set January and February lines with greater precision.
Teams that open with unexpected records often see their future opponents' lines move within days of those outcomes, while consistent statistical trends such as elevated three-point volume or defensive efficiency force oddsmakers to widen or tighten totals accordingly.
Statistical Foundations of Market Movement
Data compiled by league tracking systems shows that clubs posting above-average offensive ratings in the first twenty games experience measurable shifts in projected scoring margins when they face similar defensive schemes later in the schedule, and these projections incorporate regression toward historical norms that betting markets apply automatically.
Researchers tracking NBA box-score aggregates have documented that rebounding and assist rates from November contests frequently appear in midseason prop adjustments, because those numbers alter implied probabilities for individual player outputs in subsequent matchups.
Team-Level Adjustments and Line Shifts
Bookmakers monitor divisional standings after the first quarter of the season and apply those standings to future head-to-head matchups, which means a team that started hot against weaker opponents often sees its spread inflated when it travels to face stronger defenses in January. Observers have watched entire betting markets move several points overnight following a single overtime result that reveals hidden pace tendencies.
What's interesting is how early injury reports compound these effects. When a starting guard misses multiple games in December, sportsbooks revise that player's season-long prop lines and simultaneously adjust team totals for the opponents scheduled in February and March.
Player Props and Regression Patterns
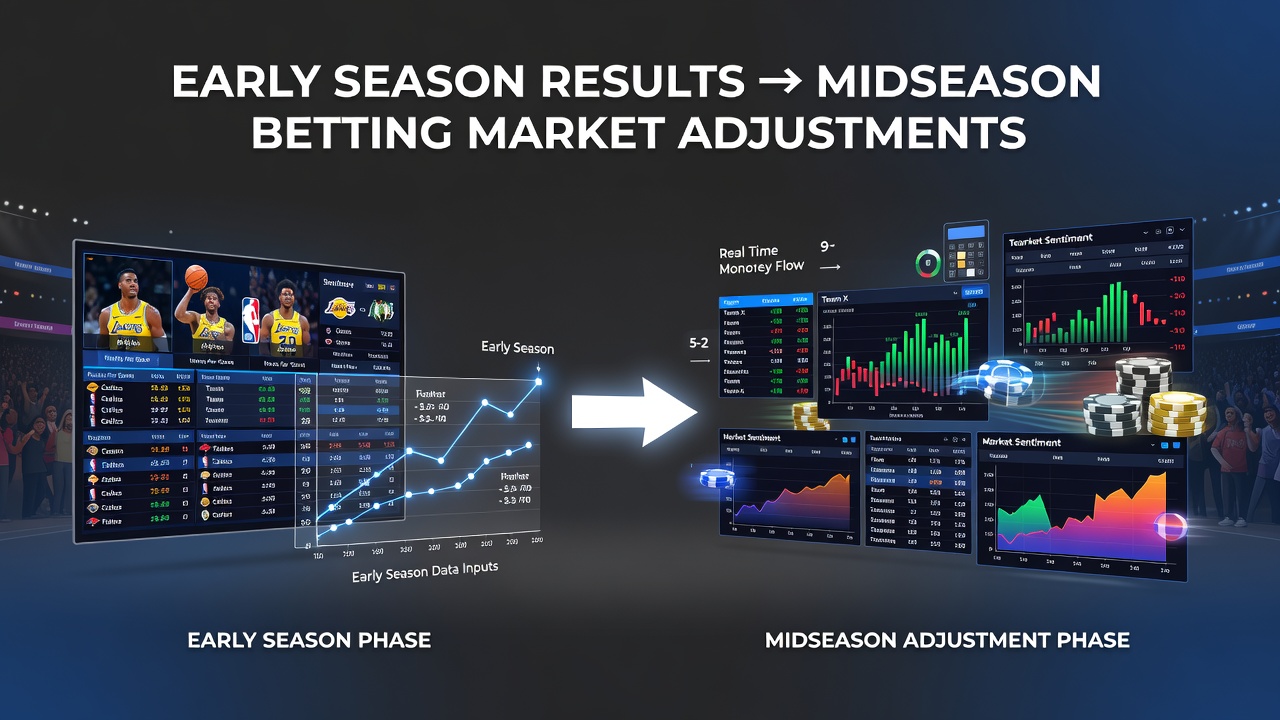
Individual betting markets respond to early statistical outliers by applying regression coefficients derived from multi-year samples, and analysts note that a rookie averaging twenty points per game through December often sees his January lines drop once opponents adjust scouting reports. These adjustments rely on league-wide data rather than subjective assessment.
Studies from academic sports analytics groups indicate that back-to-back game performance gaps become embedded in midseason totals once early season travel data is complete, which explains why totals markets tighten when teams that struggled on the second night of back-to-backs later receive favorable rest advantages.
External Data Sources Informing Revisions
According to reports published by the American Gaming Association, sportsbooks integrate external pace-of-play metrics released by the NBA into their proprietary models, and those integrations produce line movements that appear within forty-eight hours of updated league statistics. Similar processes occur when Canadian regulatory bodies publish aggregated betting handle figures that reveal public bias toward certain early season narratives.
One study from a major university sports research center found that midseason futures markets incorporate November and December win shares at roughly double the weight given to preseason projections, which creates measurable drift in championship odds and conference standings bets.
Practical Market Examples Across Seasons
Take a Western Conference squad that opens with an elite defensive rating and then faces a schedule of high-possession offenses in the new year. Midseason totals markets typically drop by three to five points once those early defensive numbers enter the models, and sharp bettors who track these shifts often place wagers immediately after teh line movement stabilizes.
Another pattern appears when Eastern Conference teams post inflated assist totals early because of favorable matchups against poor defensive rotations. Bookmakers respond by raising assist props for those players once the schedule shifts to stronger defensive opponents, and the new lines reflect the historical drop-off observed in comparable situations from prior seasons.
Conclusion
Early season NBA outcomes supply the raw inputs that drive midseason betting market recalibrations across spreads, totals, and player props. League tracking data, regression models, and external research reports combine to produce line movements that reflect updated probabilities rather than initial assumptions, and those movements continue to evolve as additional games supply fresh statistical evidence.